


As a child I remember being taken to a department store and noticing that it was full of objects with numbers displayed next to them. Almost all the numbers terminated with .99 or .95. How strange! What could it possibly mean or signify?
Later, I was gifted small coins, and exchanged them for things I wanted, like sweets and crisps. Naturally, I asked what the numbers meant. But, even as a child, I realised the adults couldn’t give a good answer.
We won’t answer this question just yet. But we’ll start to.
So far, we’ve examined technological constraints on production, which pertain to any kind of economy. Now, I introduce specific social relations of production that pertain to only certain kinds of economies at certain historical junctures.
The first institution is a private economic unit that specialises in the production of a small set of commodities. We’ll call it the firm. And, for simplicity, we’ll assume firms produce just one commodity. The firm is a private economic unit in the sense that it legally owns its outputs. It has property. Firms could be property too. But, at this stage, we do not say who or what owns the firm.
We also consider workers to be private economic units in the sense they produce labour, own themselves and in principle may specialise in any area of production.
Since the private economic units are specialised they need to get their inputs from others. The second institution we introduce is the market, which is a place where private producers meet to exchange their goods.
Finally, the third institution is monetary exchange. The producers don’t exchange their commodities directly, but through the medium of money. Every commodity has a price, and you must pay the private owner the right amount of money to acquire it.
In summary, people carry numbers in their pockets, and everything is stamped with a number.
Already this is a significant set of new social relations to consider. We’ll examine many of the consequences of this particular institutional setup over the coming weeks.
For now, consider a very simple economy, consisting of three private economic units: a firm that produces corn, a firm that produces iron, and some workers.
Figure 1 shows the corn-producing firm. It has a stock of corn (1 bushel). And it has an activity level, which is the level of output it “wants” to produce (in this case 1 bushel per hour of clock time).
The firm also has something we’ve not seen before — the price at which it is willing to sell its corn (in this case, 4 units of account per 1 bushel of corn). For ease of exposition we’ll choose an arbitrary name for the unit of account. We’ll call it a dollar. So this firm sells 1 bushel of corn for 4 dollars.

The firm also has a new kind of stock — its stock of money. We don’t care, at the moment, what particular physical form this money takes, and neither do we care where that money is stored or held. It will do no harm, at this stage, to imagine that firms hold stocks of cash on their premises. For example, this corn-producing firm holds a rather paltry stock of 1 dollar.
Finally, notice in Figure 1 that the firm produces corn with a particular technology (in this case, corn production requires seed corn as input, and labour, in definite proportions).
Here’s the iron-producing firm:
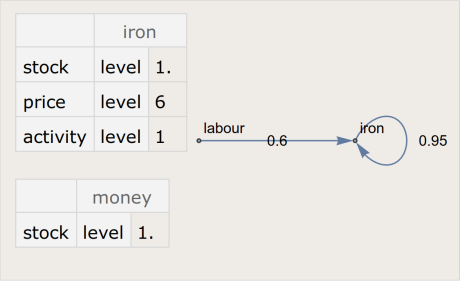
Notice that the iron-producing firm charges 6 dollars per ingot of iron.
And, last but not least, here are the workers that will power this simple economy:

The workers consume corn (in the form of bread). And, in this example, we have only 15 of them (i.e., the household sector supplies 15 person-hours of labour every hour of clock time).
The workers lack individual distinctions. For example, they collectively charge 1 dollar for every hour of labour they supply. And they pool their money. So we find a single stock of money, which currently is an underwhelming 1 dollar of cash. (The negligible stock of 1 hour of labour may be supplied without any corresponding consumption. It’s a little bit of “give” in the workers capacity to supply work).
The production graphs of the three economic units fit together (which is a fortunate happenstance we’ll take for granted). The complete technology graph for the whole economy is then:

For want of a better term we’ll call this economy a simple monetary economy to emphasise that products are exchanged via the buying and selling of goods in the market.
How does production take place in a simple monetary economy? A firm — let’s say the iron-producing firm — will attempt to produce at its desired activity level. We can think of the activity level as a very basic kind of production plan. Once its decided on how much to produce it then needs to purchase the correct quantity of inputs (as defined by its technology) from the market.
The iron-producer must purchase iron ore and labour as inputs (as per Figure 2). The only producer of iron ore happens to be itself. So that’s easy. The firm simply draws down on its stock of iron and pays itself — resulting in a net transfer of zero dollars. Buying labour is different. The firm transfers a portion of its stock of money to workers, who in return supply their labour. For example, to produce 1 ingot of iron requires 0.6 hours of labour. The price of 1 hour of labour is $1. So the iron-producing firm transfers $0.60 to the workers.
Once the necessary inputs are purchased then production begins. The workers transform iron ore to iron ingots (which are temporarily added, prior to any sale, to the firm’s stock of iron).
This same basic pattern is repeated for all economic units: the corn-producing firm purchases its inputs in a similar manner. And the workers, when they “produce” labour, must first purchase corn (in the form of bread) from the corn-producing firm. They pay for their bread with money they earned from supplying labour. They consume their bread, which refreshes them, so they can continue supplying labour. (Labour cannot be stored indefinitely like some commodities, which is why the stock of labour is clamped to a small number — see a production process for more details).
We therefore have two fundamental circular flows in a simple monetary economy: the flow of goods and services, determined by the underlying technology, and a reverse flow of money payments, determined by the system of prices. And in consequence we have two kinds of fluctuating stocks: the stocks of goods and services, and the stocks of money. Both these kinds of stocks are privately owned by the different economic units.
OK. Enough talk. Let’s produce and see what happens!
The first thing to notice is that this simple monetary economy is uncoordinated. The corn firm is overproducing, and the iron firm is under-producing. However, the workers consume sufficient bread to refresh their labour.

The money stocks, held by the different economic units, reveal more of the story:

The corn firm is accumulating cash because its selling its corn stock but not spending the money to replace it. The workers consume sufficient quantities of bread but they have to draw down on their “savings” to purchase the loaves. Either bread is too expensive, or the price they charge for their labour is too low. Production at these prices is unsustainable.
Note, however, that the total stock of money, in Figure 6, remains constant throughout (if you add up the levels at each time step it always equals 3 dollars). As we might expect, money is conserved in exchange. The money continually flows between the economic units but — at any instant of time — the cash is always owned by someone.
Here’s what happens eventually:

Something dramatic happens at around t = 80. The stock of corn starts climbing again, but the stock of labour suddenly starts oscillating. This indicates that labour was supplied that was not replaced by any corresponding consumption. Here are the money stocks:
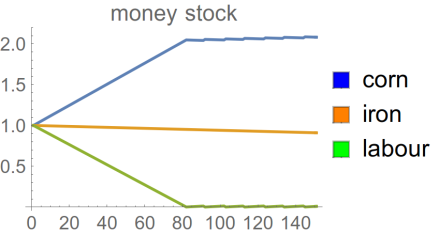
The dramatic event is that the workers run out of money. At around t = 80 their cash holdings hit zero. So they cannot purchase bread in the market. In consequence, although they continue to supply labour (to the corn and iron firms) they do not enjoy any corresponding consumption (and therefore tire and draw down on their reserve stock of labouring capacity).
Why do we see oscillation in the stock of labour? Well, for short periods the workers supply labour from their reserve capacity. They get paid for this work (you can see very small upticks in workers’ money stocks in Figure 8). Immediately, they spend their newly earned cash on bread in the market, which replenishes them, restoring their reserve capacity. But this does not solve the problem. Bread is too expensive, or the price of their labour too low. They are quickly back to zero cash again, and so the cycle repeats.
In this simple monetary economy everything is out of balance: the activity levels are uncoordinated — causing over and under production — and the prices are unsustainable — causing an eventual breakdown where workers cannot afford their basic needs.
In sum, the economic units need to adjust their behaviours. They need to alter the amounts they produce and the prices they charge. This economy faces the same coordination problem with the same theoretical solution but in the context of a specific set of social relations of production, that is an economy with private ownership, markets and monetary exchange. Understanding how a market economy partially solves the coordination problem — in historical time — is a necessary step to understanding what those numbers in our pockets really mean.
Just how that happens will be the subject of a sequence of posts.

This model actually seems to capture the dynamics of the recession of the famous Capitol Hill baby-sitting coop (google it).
Can you please share the Mathematica workbook for this example? I’d be interested to really see what is going on inside to reach that breakdown point at t=80.
LikeLiked by 1 person
I wasn’t aware of the story of the baby-sitting co-op. Certainly relevant. The co-op organisers would have benefited from reading Pasinetti’s analysis of a pure labour economy, and the conditions for its reproduction, in his brilliant 1981 book, “Structural Change and Economic Growth: a Theoretical essay on the dynamics of the wealth of nations”.
The Mathematica code and associated notebooks, which I use for each post, have a GitHub project:
https://github.com/ianpaulwright/from-here-to-there
Feel free to investigate. But the code is super-early and work-in-progress, and comes with no warranties. It will change. But you may notice that the main simulation engine (in economy.m) is already quite general, and can model quite a bit more than I’ve blogged about. I intend to write a post describing the code, and how to use it, in the future.
Thanks for your comment!
LikeLike