


(If you prefer to watch a video see Video of “Social Architecture of Capitalism” at CU 2019).
Things are getting worse
In the last 30 years economic inequality has significantly increased. People at the bottom struggle for food and shelter, while those at the top earn many years worth of the average salary while they sleep. The majority in the middle work hard yet lack savings, living their entire lives a few paychecks from destitution.
Recently I counted 5 people sleeping in shop doorways on the Cowley Road. Such a scene was unthinkable 30 years ago. But homelessness is just one highly visible symptom of a much bigger social catastrophe.
Things have got so bad that even mainstream discourse has shifted to reflect the new reality. We’re routinely told that millennials face low wages, poor quality jobs, high debt, and worse economic outcomes compared to their parents. People now accept that the political system is rigged by a rich elite who’ve captured the institutions of the nation state. And even the arch conservative world of academic economics talks about inequality. And that simply didn’t happen just 10 years ago.
For supporters of capitalism, both on the left and right, this worsening situation poses something of a problem. Obviously something has gone wrong. But what?
A typical response
The Institute for Public Policy Research, a Blairite think tank based in the UK, issued a report on economic inequality in October of this year. The report presents a typically centrist response to this social crisis.
The report surveys the empirical data, which paints the familiar and depressing picture. The majority have almost no wealth and are in debt. 5 million people earn less than 8 pounds 10 per hour. In contrast, the richest 10% own 50% of the nation’s wealth. And the majority of that wealth is unearned, since it’s obtained, not by supplying labour, but by the mere ownership of assets.
So what are the causes of such extreme inequality, and why is it increasing? This is the big question the report aims to answer.
The authors give 5 reasons why inequality is increasing:
- First, housing. The rate of home ownership is falling.
- Second, capital. It’s not equally owned. So profits are not equally distributed.
- Third, governments. They’ve decided to tax the wealthy less and less.
- Fourth, wages. They’re too low. So people can’t save and accumulate wealth.
- Fifth, demand for labour. It’s decreasing due to automation and so-called digital capitalism.
I’m not going to waste time to explain why these reasons are bunk. Instead, I’ll simply state they are symptoms of increasing inequality, not causes of it.
So the report completely fails to answer the question it poses. And I’m pleased to say, in a very smug way, that this is exactly what I expected before reading it.
I also expected, and was happy to have my prejudice confirmed, that the report would avoid any mention of workers and capitalists. Of course, there’s plenty of talk of social stratification as defined by market researchers. But the report neglects to mention that capitalism is a system in which one economic class systematically exploits another.
And its economic exploitation — not housing, tax policies or low wages — that is the root cause of the economic inequality we see all around us.
In this post, I want to make that claim very real: I want to demonstrate that economic exploitation explains economic inequality, and therefore why most mainstream talk of inequality totally misses the point.
Modelling anarchy
To make the claim we need a model of economic exploitation.
But we hit an immediate problem. An economy consists of huge numbers of people interacting all the time. It’s anarchic. How can we construct an economic model that predicts the consequences of millions and millions of people interacting?
Well, one good way to understand systems with huge numbers of degrees of freedom is to view them as randomising machines that maximise entropy subject to constraints.
I’ll explain that statement, step-by-step, with an example.
Imagine we have a cocktail shaker full of millions of particles of sand. We shake the sand very vigorously so the particles bounce around. Then, at one instant of time, we measure the speed of every particle. So we get millions of individual speed measurements.
We then plot a histogram of those speeds. We count how many particles have a speed between 0 and 1 m/s. And we count how many have a speed between 1 and 2 m/s. And so on. So for every speed interval we get a count of how many particles with that speed.

What we find is that most grains of sand move very slowly. Less and less grains move at higher speeds. And only a tiny number move really fast.
Let’s imagine we continue shaking the sand and measure the speeds again a few moments later. The speed of each grain has changed. Slow grains now move fast and vice versa. But the overall distribution of speeds has not changed. The histogram looks the same.
For systems with a huge number of degrees of freedom, like the sand in our cocktail shaker, the speed of an individual grain is pretty much random and unpredictable. In contrast, the overall distribution of speeds is very regular, and seems to follow a simple law. In fact, the distribution of speeds is an example of a negative exponential distribution.
So why is this? Why does micro level randomness generate macro level regularities?
When we shake the sand we introduce kinetic energy into the system. A head-on collision between two particles lowers the speed of both. But a particle gets a speed boost if hit from behind. By shaking we randomly transfer energy between particles.
Most of the time, any speed gains from one collision are quickly lost in the next. And this is why most particles have a low speed. But a very small number of particles are lucky and have a sequence of speed-increasing collisions. These are the super fast particles.
We can formalise these ideas in terms of entropy. Think of entropy as a number that measures the randomness of a distribution. The higher the entropy the more random the distribution.
The most random distribution of all is the uniform distribution:

A uniform distribution corresponds to finding the same number of sand particles at every speed. It’s the most random distribution because every speed is equally likely.
But we don’t see a uniform distribution. We see an exponential distribution, where lower speeds are more prevalent than higher speeds.
Shaking randomises the distribution of energy in the system and increases its entropy.
But there’s something that prevents the shaking from fully maximising entropy. There’s some kind of obstacle in the system that acts to reduce the randomness a little bit. There’s a constraint on entropy maximisation.
That constraint is the conservation of energy.
I add energy by shaking, and the system loses energy as heat and sound. Roughly speaking, the net change of energy in the system is zero. So although each collision transfers unequal amounts of energy the total energy in the system is always conserved.
We can calculate the distribution that corresponds to maximum entropy subject to a total energy constraint. And it turns out the answer to this optimisation problem is the exponential distribution.
So we have the beginnings of a method to understand systems with a huge number of degrees of freedom. At a micro level the system scrambles and randomises. Basically anything can happen. But at the macro level there are global constraints that are always observed. So there’s an interaction between forces that randomise, and forces that order. The technique of maximum entropy can sometimes predict the consequences of that interaction.
Markets as entropy maximisers
Somewhat surprisingly, these ideas apply very directly to economic systems.
Market transactions involve a transfer of monetary value. After any transaction one party may have more or less money than before.
It’s quite easy to write a short simulation program that takes a large collection of individuals that start with equal amounts of money. We then pick two individuals at random. One is the buyer. We randomly choose a proportion of their money to spend. The seller gets that money. We then repeat, and pick another two individuals at random. And we keep doing this forever.
After a short period, we can then measure the distribution of money across individuals. And we find, once again, the exponential distribution. Most individuals have very little money, and a small number have a great deal.
So the activity of market exchange is acting just like the cocktail shaker: its mixing everything up, randomising things, and maximising the entropy of the system.
You can see this process happening in real time in this video (after the work of Victor Yakovenko, who I collaborated with on Classical Econophysics):
You might think that this model of money exchange is far too simple to tell us anything about real markets. But you’d be wrong.
Remarkably, we observe the exponential distribution in actual economies. The exponential is a great fit to the bottom 80% of the wealth distribution, which is the vast majority of the population. And this holds true for whichever capitalist country we look at.
The fact that 80% of the wealth distribution of actual economies follows an exponential law is a very astonishing regularity.
We might think that differences in wealth must arise from accidents of birth or personal virtue. But the principle of entropy maximisation tells us there’s a much more important causal factor at work. We quickly get extreme income inequality even in an economy with identical individuals with identical initial endowments of money.
The points is that markets are randomising machines, they maximise entropy, and this fact alone is sufficient to explain some of the inequality we observe.
So the anarchy of the market is the primary and essential cause of economic inequality.
But why doesn’t the exponential law fit the entire wealth distribution? What about the remaining 20% of rich people?
Well, there must be another constraint on the system in addition to the conservation of money in exchange. Some additional principle, which we have yet to specify, must be reducing the entropy of the system.
The social relations of production as constraints
This paper contains a macroeconomic model of capitalism. Although simple it has remarkable explanatory power.
The model assumes, as before, that the population and total quantity of money are fixed.
But the model adds some new non-random constraints to the system that derive from the fundamental social relation of capitalist societies: that capitalists hire workers, pay them wages, and keep the profits.
So an individual in this model, at any time, is only in one of three states: either unemployed, working for another person, or an employer.
And money now flows in new ways in virtue of the wage system. These distributional rules add more constraints to the system, reducing its entropy.
Analogously, we’re adding some internal structure to our cocktail shaker. We will add a little divider, or filter, near the top of the shaker. Sand can flow across this filter. But once sand is in the top, it’s less likely to fall back to the bottom.
So I’m going to spend the next few minutes describing the rules that govern how individuals switch state and transfer money between them.
How do people get hired?
I model the wage system in a very simple way. If a person is unemployed then there’s some probability they get hired by an employer. Richer employers are more likely to hire more workers because they can afford a bigger wage bill.
There’s a small chance that a currently unemployed person will hire another unemployed person. One person then becomes the employer, and the other a worker. This is how new firms get born.
How are people paid for their work?
Employers pay out wages to all their employees in return for their labour. The wage is chosen randomly from a fixed range, which is quite wide. So although there’s an average wage in the system, individual wages vary widely around that average.
How do people spend their income on goods?
All individuals — whether they’re currently an employer, employee or unemployed — spend their money in the market for consumer and capital goods. They spend a random amount between 0 and their current money holdings. This expenditure adds to the aggregate demand in the economy.
We don’t bother to specify what actual goods and services are purchased. We’re just interested in the money flows.
When workers spend we assume they’re buying consumption goods. When employers spend we assume they’re buying both consumption goods for themselves and capital goods for their firm.
How do firms produce and sell goods?
The individual capitalist enterprise, or firm, is simply a hierarchical relationship between a single employer and a plurality of employees.
Each worker supplies labour that adds value to the firm’s product. But how much value do they add? Well, we don’t bother specifying that. We just care about macro level constraints. We simply assume that any individual worker must add value somewhere between absolutely nothing and the current level of aggregate demand in the market.
Some work might be useless, and harm the firm’s revenue, whereas some work might be super valuable. At this micro level anything can happen, subject to the hard constraint that no worker can possibly generate more revenue than the available purchasing power.
So workers generate income for their employers. The employers pay wages. And any residual income is their profit.
How are workers fired?
No-one is fired if the employer can pay its total wage bill. Otherwise, the firm’s workforce is reduced to a size that it can afford to pay.
For example, if a firm needs to fire 10 workers then 10 are chosen randomly. So firms that fail to make a profit will shed workers. Conversely, firms that make lots of profits will tend to hire more workers.
If a firm fires all its workers then its dissolved. And this is how firms eventually die and cease trading.
How is this all put together?
And that’s it. The model encodes some very basic facts about the social relations of production.
The social relations constrain the system, which otherwise is free to evolve pretty randomly.
But solving the maximum entropy problem for this model is quite hard. Luckily, we can instead simulate the system and then simply observe the distributions that get generated.
So the paper describes a simulation model where we repeatedly apply update rules to many thousands of individuals. Running the program is just like shaking the cocktail mixer.
The simulation begins with a population that holds equal amounts of money, and who are all unemployed. Then the individuals randomly bounce around, exchanging money, getting hired and fired, forming new firms and so on, all within the constraints of a wage system.
What does this model predict?
So what does this model predict? What happens?
On p. 599 of the paper I plot the distribution of individuals across economic classes: that is employers, workers and the unemployed. The distributions turn out to be normal.

Remember that, over time, individuals change class: a worker may get fired, and hired again, or start a new firm, and become a small capitalist. Firms can fail, and capitalists can rejoin the ranks of the workers. So everything is changing all the time.
But these plots show that all this churn results in stable distributions. The proportion of the population in each class fluctuates around definite mean values.
About 71% of the population are workers, 12% are capitalists, and 16% are unemployed, which is a pretty good approximation to real life.
It’s remarkable that the model self-organises into a class division of society, with a minority of employers and a majority of workers.
On p. 600 I plot the size distribution of firms measured by number of employees.

The distribution is a very good fit to what is known as a Zipf law. In other words, there’s a large number of very small firms, and a small number of very large firms.
Again, this macro-level regularity summarises a huge amount of micro-level change. Firms are born, grow, and die all the time. Nonetheless, the number of firms of different sizes is stable.
And, remarkably, this size distribution of firms in actual capitalist economies is also Zipf.
On p. 601 I plot the distribution of the growth rates of firms, measured either in terms of increase or decrease in sales or employees.

This distribution follows a Laplace distribution. This means that, for most of the time, the size of a firm changes very little, but less frequently the change is size can be dramatic, either rapid growth, or a mass layoff event.
And, once again, we also find a Laplace distribution in the empirical data on firm growth.
Page 603 plots how many firms go bankrupt and cease trading within a short period of time.
The model generates a log normal distribution, which means that, in most time periods, a handful of firms go bust, but occasionally we get mass extinction events.
Remarkably, the empirical data also exhibits a log normal law of firm deaths.
On p. 604 I plot the change in GDP from year to year, where GDP is defined as the total income of firms during a simulated year.

The simulation generates another Laplace distribution, which also matches the empirical data of GDP growth for actual national economies.
We can measure the duration of recessions in the model, which is the number of successive years in which GDP is less than the last.
 The simulation produces an exponential distribution. So there’s many quick recessions and a smaller number of long recessions.
The empirical data on actual recessions is consistent with an exponential law (but the consensus is that it follows what’s called a power law distribution). But the model is pretty close to reality even here.
Page 614 plots the profit rate of firms. I define profit very simply (and somewhat inaccurately) as the excess of firm income over wage costs.
 We find that profit rates vary considerably. They cluster around a non-negative peak, with a long power law tail. So, at any time, most firms make an average profit, some make a loss, but a small number make super, super profits.
The empirical profit rate distributions are qualitatively very similar to Figure 12.
The specific inequalities of the wage system
Now, at last, we can turn to the main question at hand: what kinds of economic inequality does this model generate?
Page 608 plots the distribution of individuals’ incomes earned over a simulated year:
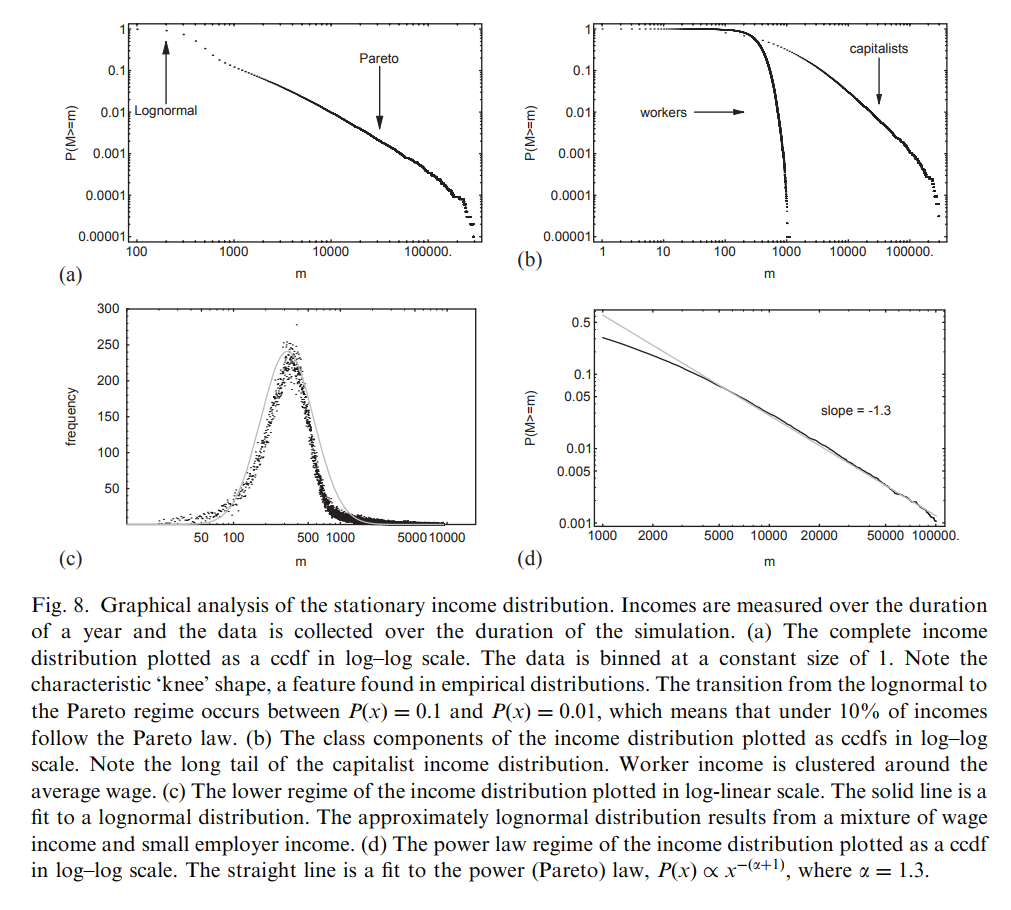
As expected, the distribution of income is very unequal. But we see two distinct regimes: a lower regime consisting of wage income, and a higher regime of profit income.
Wage income follows a log normal law. So there’s wage inequality, with a small number of workers earning high wages, with the majority clustered around a mode.
Profit income, contrast, follows a Pareto distribution, which has a long tail, which means that we find some individuals with super, super high income. In fact, the inequality of within profit income exceeds the inequality within wage income. So some rich people are enormously much richer than others.
And, once again, this 2-regime distribution is precisely what we find in real economies. It really is one rule for the rich and another for the poor.
The distribution of wealth has a similar 2-regime structure. Wealth obeys an exponential law for workers, and a Pareto law for capitalists.
So what really causes inequality?
So we now have a model that replicates a broad range of empirical data about actual capitalist economies.
What does the model tell us about the root cause of economic inequality?
We saw that maximising entropy under the single constraint of conservation of money yields an exponential distribution of wealth. That’s quite unequal. So the first cause of inequality is what Adam Smith called the higgling and haggling of the market. Since people are free to trade then entropy increases and the distribution of money becomes unequal.
But we don’t find an exponential distribution in actual capitalist economies. We find something more complex. That’s because capitalist economies obey additional constraints on how money moves between individuals. Markets are not the only cause of the inequality we see in capitalism.
Production in capitalism takes place in institutions that have two distinct classes of participants: those that own the firm, and get the profits, and those employed by the firm, who get paid in wages.
We can think of capitalist firms as little social machines, operating within the context of a market economy, that “sort” individuals into different classes by means of the wage system. This sorting reduces randomness, and lowers the entropy of the overall system. The maximum entropy distribution, in these circumstances, is then different: it has 2 regimes, one for capitalists and another for workers.
Firms follow a power law distribution in size. And capital concentrates in the same way. A large number of small capitals exploit a small group of workers, and a small number of big capitals exploit a large group of workers. Profits are roughly proportional to the number of workers employed. So capitalist income also follows a power law.
The more workers you exploit the more profit you make. The more profit you make the more workers you can exploit. And once you hit the very rich bracket you enjoy positive feedback effects.
In this elevated state, you can fall asleep, wake up the next morning, and have earned more than workers do in their entire lifetimes.
So the second cause of economic inequality is the wage system itself.
Stop talking about inequality, start talking about exploitation
We can now see what is completely missed by mainstream analyses of economic inequality.
The IPPR report stated that the main causes of increasing inequality are the unequal ownership of capital, housing policy, low wages, regressive taxation and automation.
But we’ve just seen that, even if we reset society to a perfect and equitable state, where classes have yet to form and everyone has equal wealth, then — as a consequence of the iron laws of thermodynamics — the mere existence of markets and a wage system will rapidly produce exactly the kind of inequality we see around us today.
So the point is this: the fundamental social architecture of capitalism is the main cause of economic inequality. We can’t have capitalism without inequality: it’s an inescapable and necessary consequence of the economic rules of the game.
Government policy can, of course, attempt to control this basic tendency. And most of us would derive marginal benefit from more enlightened housing, tax and wage policies. But such piecemeal reforms are a plaster on a gaping wound.
And since the rich capture democratic institutions even such mild reforms are easily swept aside. We’ve seen a collection of post-war policies, that controlled economic inequality, ditched in the last 30 years. And that’s why things have got even worse.
Extreme economic inequality causes untold misery. At the top we see excessive and wasteful hyper-consumption. At the bottom, countless everyday struggles to live a dignified life.
And decades of political reforms have not produced a fair and equitable society. And they never will. It’s hopelessly utopian to think they could.
Getting serious about economic inequality requires thinking about the fundamentals: which is the wage system, where one class systematically exploits another. We need much less talk about inequality, and much more talk about exploitation.
Copyright © 2017 Ian Wright
(2005) The social architecture of capitalism. Physica A: Statistical Mechanics and its Applications, 346, pp. 589-622. PDF

Reblogged this on Declaration Of Opinion.
LikeLike
Hi Ian,
thanks for this excellent article. I follow your work on the econophysics and methods of applying statistical mechanics to economic phenomena. Each of your articles is very interesting and fun.
I would like to ask you, can we apply the principles of statistical mechanics on the classical type of demand in the economy? We have a large number of customers who constantly change their preferences and can we consider distribution of prices for some goods as the result of the statistical equilibrium in long time? It’s presuppose that we have constraint in constant income, null-inflation, stability in quantities of one commodity etc.
So can we say that the classical demand curve might be statistical equilibrium of consumers preferences for one given time?
LikeLike
I would expect so, yes, although I haven’t done it (since I’m less interested in microeconomics). For example, Duncan Foley’s 1994 paper, “A statistical equilibrium theory of markets”:
http://www.sciencedirect.com/science/article/pii/S0022053184710180
subverts the standard Walrasian pproach by applying statistical principles. I also think Masanao Aoki’s sequence of books (1996, 2002 & 2007) are full of great ideas.
Best wishes!
LikeLiked by 1 person
Hi Ian, great work.
I just to wanted to ask you what you think of Jonathan Nitzan and Shimshon Bichler’s “Power theory of value”, their ‘Differential accumulation’ approach and the rest of it?
They put their two books for free on their website:
“Capital as Power: A Study of Order and Creorder”: http://bnarchives.yorku.ca/259/2/20090522_nb_casp_full_indexed.pdf
“The Global Political Economy of Israel”: http://bnarchives.yorku.ca/8/2/20020901bn_gpe_of_israel.pdf
I really like how they use Lewis Mumford’s work.
Also, you talk here a lot about capitalism but never about the (ongoing) resistance to it. The work of James C. Scott, especially his two books “Weapons of the Weak: Everyday Forms of Peasant Resistance” and “Domination and the Arts of Resistance: Hidden Transcripts ” are really helpful.
James C. Scott’s stuff is gold.
I know you don’t like microeconomics stuff but I really recommend take at how Massimo De Angelis uses Elinor Ostrom’s work in his most recent book “Omnia Sunt Communia: On the Commons and the Transformation to Postcapitalism”.
Heterodox econ people should pay more attention to Commons/commoning.
LikeLike
Hi Paul,
Thanks for commenting, and sharing the links.
I agree that everyone should pay more attention to commoning, and I hope to read De Angelis’ latest!
I don’t mention resistance to capitalism much since other people talk about this all the time. I think that more attention should be devoted to the political economy of socialism, and how that translates into a strategy of constructing new institutions that replace, rather than resist, capitalist institutions. In a way, replacement is the most effective kind of resistance.
I’m aware Nitzan and Bichler’s work. Some if it I find very compelling. But their “power theory of value” is a retrograde step. Like many left-leaning intellectuals, in the latter half of the 20th Century, N&B dropped Marx’s theory of value due to the transformation problem. So they reject the law of value. But, as I’ve argued in other posts, that’s a big mistake.
Best wishes,
-Ian.
LikeLike
There’s also Roland Paulsen’s book “Empty Labor: Idleness and Workplace Resistance”, which contains plenty of data that you could use in your critique of wage-labour.
LikeLike
Is the code for your model available anywhere?
LikeLike
Hi Matt,
My related paper:
http://www.economics-ejournal.org/economics/journalarticles/2009-19
has a link to the mathematica notebook (see under “data set”), which you can view with the free Mathematica reader. A bunch of follow-up papers by other authors have replicated my results, and I can post those references here if you’re interested.
Best wishes,
Ian.
LikeLike
“The model assumes, as before, that the population and total quantity of money are fixed.”
The first line of counter-attack on this model seems to me to challenge this assumption ‘population and money supply grows’ say the pro-capitalists: do you have any versions of the model that assume growth in either of these, or any idea what relaxing these constants would do to your model?
LikeLike
Hi Bill,
Thanks for your question, and apologies for the tardy reply. It would be really easy to add an increasing population and a variable money supply. The code is available for anyone to try. I’m not super-motivated to do it myself, however, since the fixed population in the model can also be interpreted as a fixed workforce with a balanced entry of young and exit of older workers. The lifetime of an “individual” in the model would then map to multiple lifetimes of living individuals. Granted, it would be better to model this properly, but I don’t think it would modify the main points. Similar statements can be made about the assumption of a fixed money supply: we can interpret it as deflated nominal value of a growing money supply. But, again, it would be better to model state and bank money in a more realistic manner. I am interested in adding more institutional realism to the model (lots of ways this should be done: state, capital markets, banks, etc.). Would such modifications significantly alter the main message (that exploitation causes inequality)? I doubt it.
Best wishes!
Ian.
LikeLike